SNG Analyzer - Snapshots
Below is a preview of some of the chart options available in the SNG Analyzer.
Analyze Your Profitability
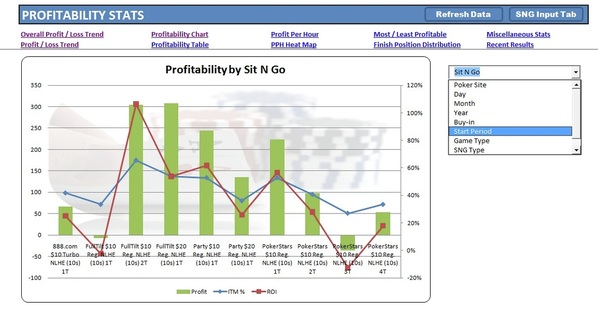
The interactive charts within the SNG Analyzer means you can see your profit, ROI, PPH, ITM% etc analyzed between various elements.
For example, analyze your data by Poker Site, Day of the week, Year, Buy-in level, SNG Type or Time of the day.
Simply select the option from a drop-down box and the chart will update.
For example, analyze your data by Poker Site, Day of the week, Year, Buy-in level, SNG Type or Time of the day.
Simply select the option from a drop-down box and the chart will update.
Other Analysis Options
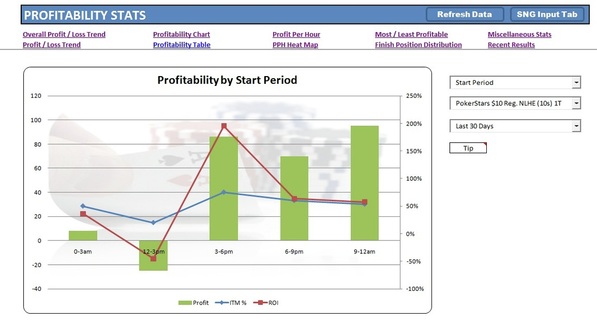
Not only can you chart your results as explained above, you can also limit your data by time period, or to a single SNG game type played.
For example limit your results to the last month, 3 months, or year. Or choose to show just the last 30 or 100 games played.
Any combination of the filters shown can be used to analyze your data and show you just what you need to know.
For example limit your results to the last month, 3 months, or year. Or choose to show just the last 30 or 100 games played.
Any combination of the filters shown can be used to analyze your data and show you just what you need to know.
Profit Per Hour
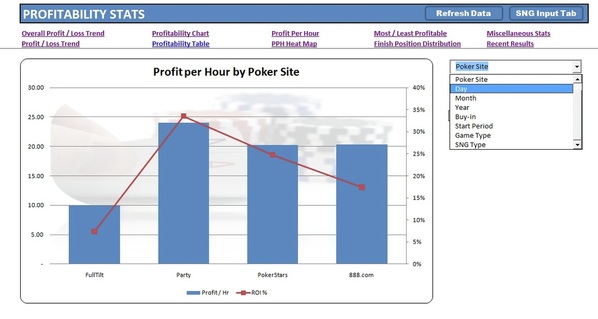
Profit per hour (PPH) is possibly the most important statistic you need to be aware of. You can use the SNG analyzer to show your PPH by Buy-in level, Poker Site etc
More importantly, by splitting your PPH by Sit N Go type, you can see whether playing 1, 2 or 3 etc tables at once is improving your PPH.
Remember, your overall goal should be to maximize your PPH, not your ROI.
More importantly, by splitting your PPH by Sit N Go type, you can see whether playing 1, 2 or 3 etc tables at once is improving your PPH.
Remember, your overall goal should be to maximize your PPH, not your ROI.
Trending
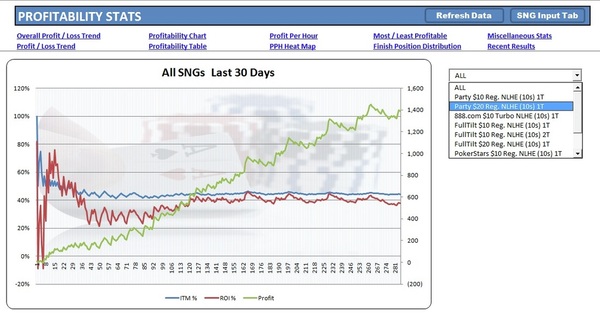
Track your profit / loss total, as well as each individual profit / loss between each type of SNG you play.
ROI and ITM percentages are also trended.
ROI and ITM percentages are also trended.
Easy Data Input
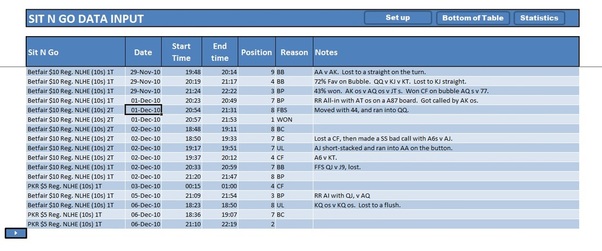
To enter a new SNG, simply click the start button in the bottom left hand corner of the table. This will enter the current date and time into the table.
When you have finished the SNG simply click the stop button and enter your position in the table.
When you have finished the SNG simply click the stop button and enter your position in the table.
